STRC: A $120B Financial Primitive That Could Send BTC to $650K

In July 2025, Strategy quietly launched something that most of the financial world didn't know how to categorize. It wasn't a bond, equity, or even an ETF. Strategy launched STRC, a yield-bearing, Bitcoin-backed, monthly-paying preferred stock that has since grown into the apex form of what is now being called Digital Credit. We believe that Strategy’s equity preferred stock STRC isn’t just a new financial primitive, but one that could fuel hundreds of billions of dollars in BTC demand and send BTC to $650K before the end of the decade.
In this blog post, we cover in detail how that’s possible. To understand this, we start with the origin story behind STRC. After that, we'll build the case that STRC, like every major technological breakthrough before it, is following a classic S-curve adoption cycle.
We'll walk through the math behind three growth scenarios, quantify what that demand could mean for bitcoin's price, and close with an honest look at where the analysis could be wrong. By the end, you'll have a framework for thinking about STRC not just as a yield product, but as one of the most consequential bitcoin demand drivers that nobody is currently pricing in.
The TL;DR Story of STRC
For four years, Strategy funded bitcoin accumulation through convertible debt, instruments that worked well when MSTR's volatility gave investors a valuable conversion option. As bitcoin matured, volatility compressed, spot ETFs launched, and institutional participation deepened. The embedded option became less attractive just as Strategy's mNAV collapsed from nearly 4x in November 2024 to below 1x by early 2026, making common stock issuance mechanically dilutive to bitcoin per share.
STRC solved two problems at once. It raises capital for bitcoin purchases without creating a maturity wall or diluting the common share count, funding yield to income investors in exchange. Strategy became, in effect, a volatility refinery: separating a single hard asset into two distinct products for two completely different investor bases, with the yield going to preferred holders and the price upside staying in the common equity.
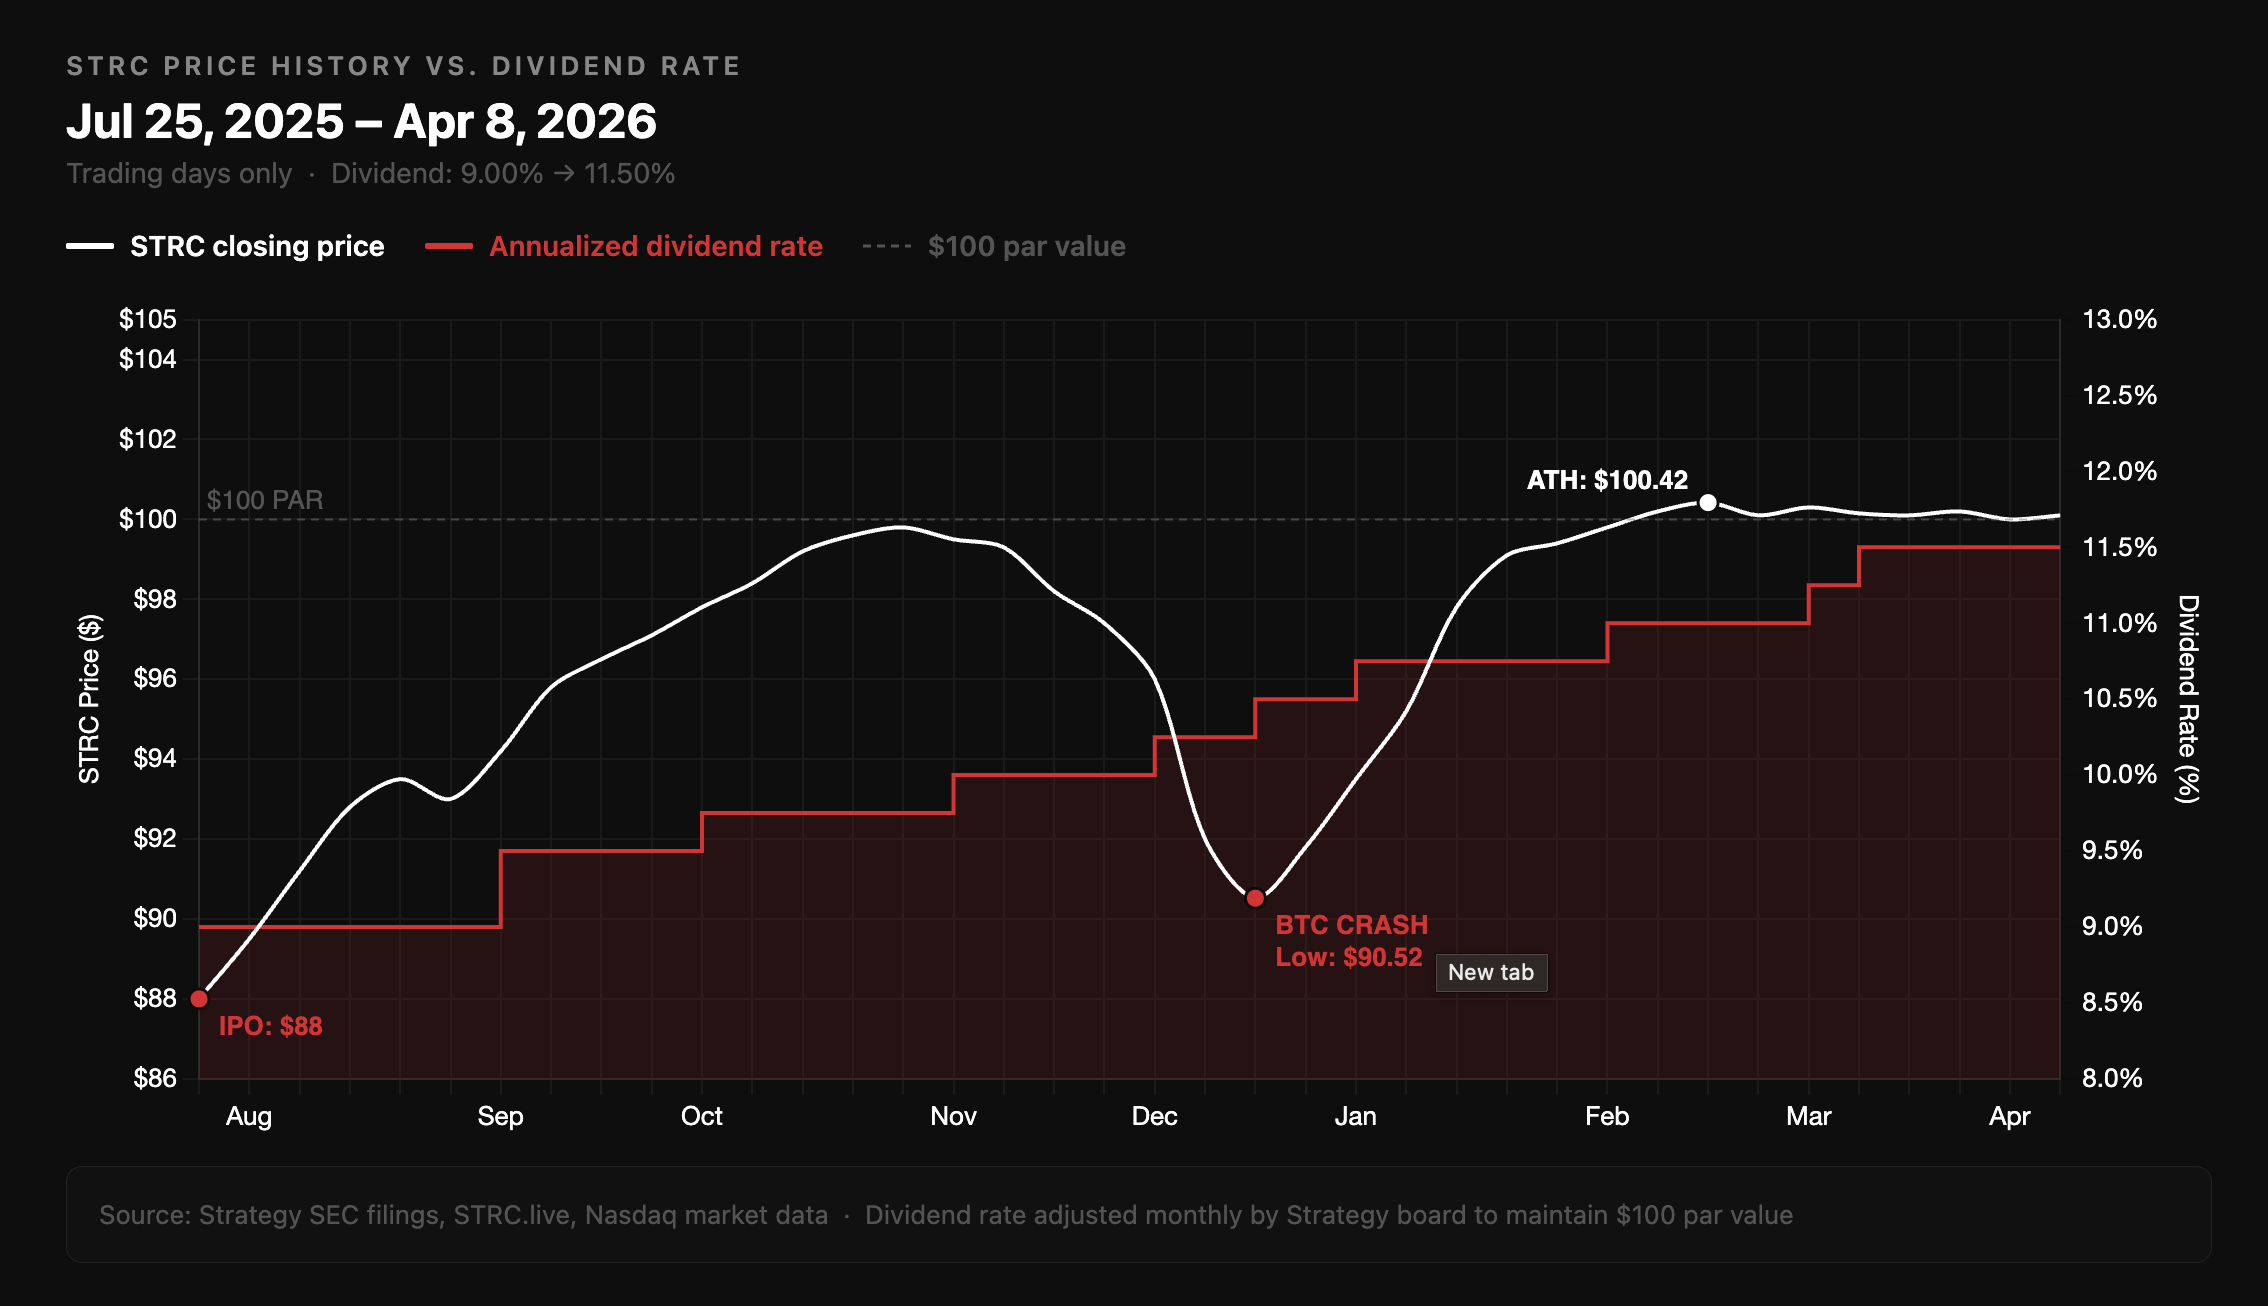
The numbers validate the framing clearly. STRC's July 2025 IPO raised $2.52B, the largest U.S. IPO of 2025, larger than Figma, CoreWeave, and Circle. By late March 2026, cumulative issuance had reached $4.76B, and the week of March 9 - 16 alone saw $1.18B in STRC sales, the first time preferred stock surpassed common stock as Strategy's primary bitcoin funding vehicle.
Through two significant bitcoin drawdowns, STRC has maintained 30-day realized volatility of roughly 1.5% annualized, lower than money market funds during stress events, supported by a variable dividend mechanism that has been raised seven consecutive times from 9.00% to 11.50% to keep the price anchored near $100 par. Not only that, but STRC has offered a meaningful way to have BTC exposure while being a fraction of the volatility; BTC and MSTR's annualized volatilities currently stand at 59% and 64%, respectively.
That structural resilience reflects the balance sheet behind it: more than $54B in bitcoin backing $10.7B+ in preferred notional, $2.25B in dedicated cash reserves covering over two years of dividend obligations, and a new $21B STRC ATM filed on March 23, 2026. The question worth asking now is not whether this instrument works. It demonstrably does. The question is what its adoption curve looks like at scale, and what that means for bitcoin's price.
S-Curves: The Shape of Every Technology That Has Ever Mattered
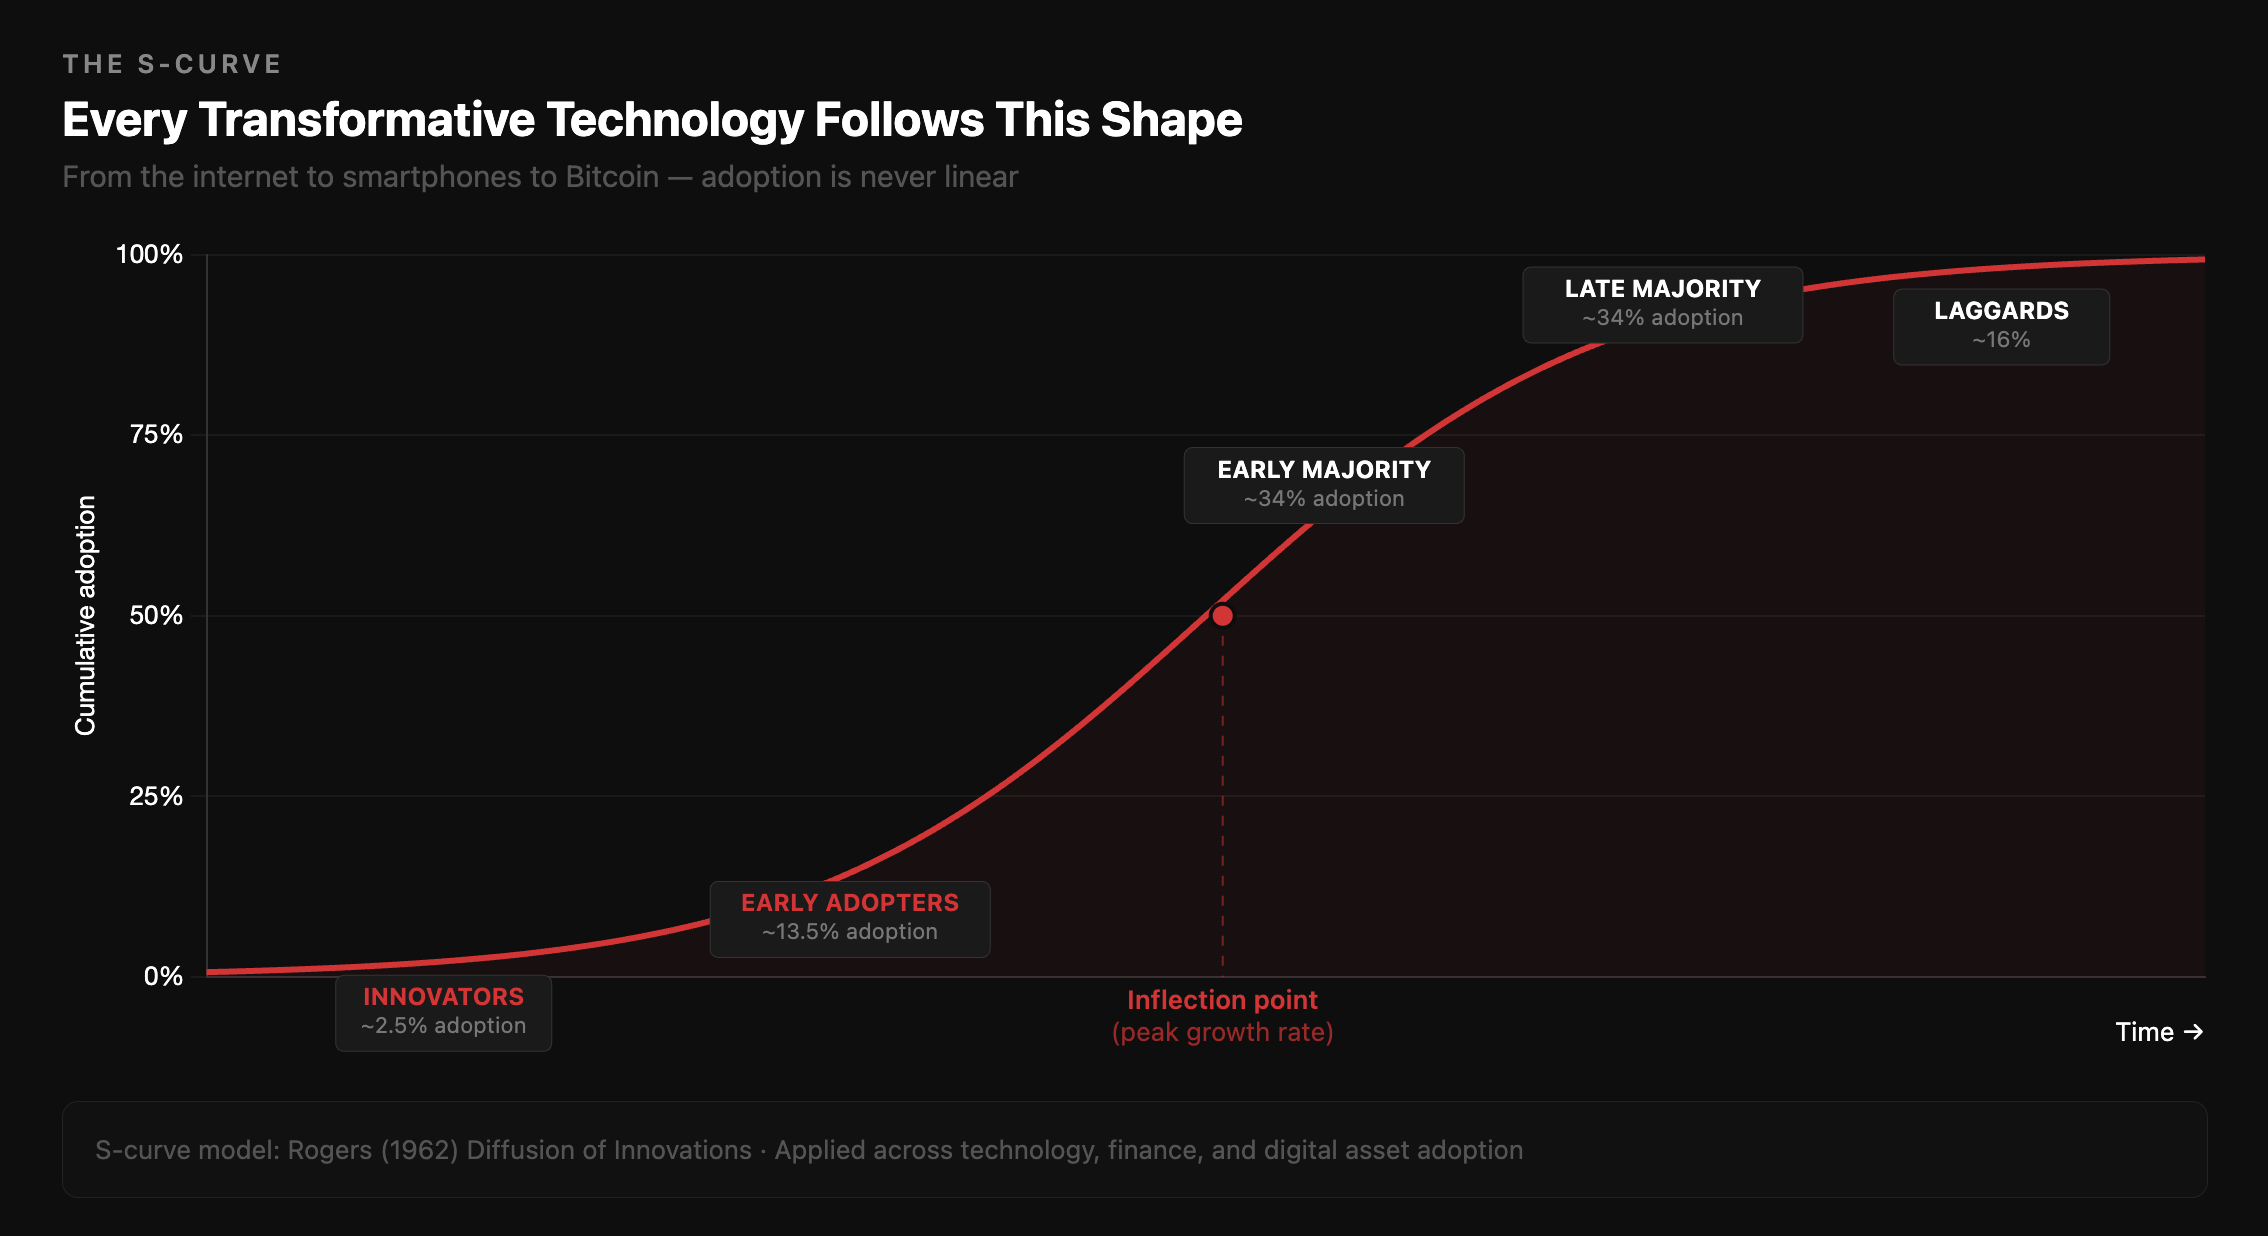
Every transformative technology in history has followed the same mathematical shape when plotted over time: slow at first, then explosive, then a plateau. This kind of explosive growth is commonly referred to as an S-curve, or logistic growth model. It shows up not because someone designed it that way, but because of a universal dynamic: adoption is limited by awareness and access in the early phase, accelerates as network effects and social proof compound, and eventually saturates as the addressable market becomes fully penetrated.
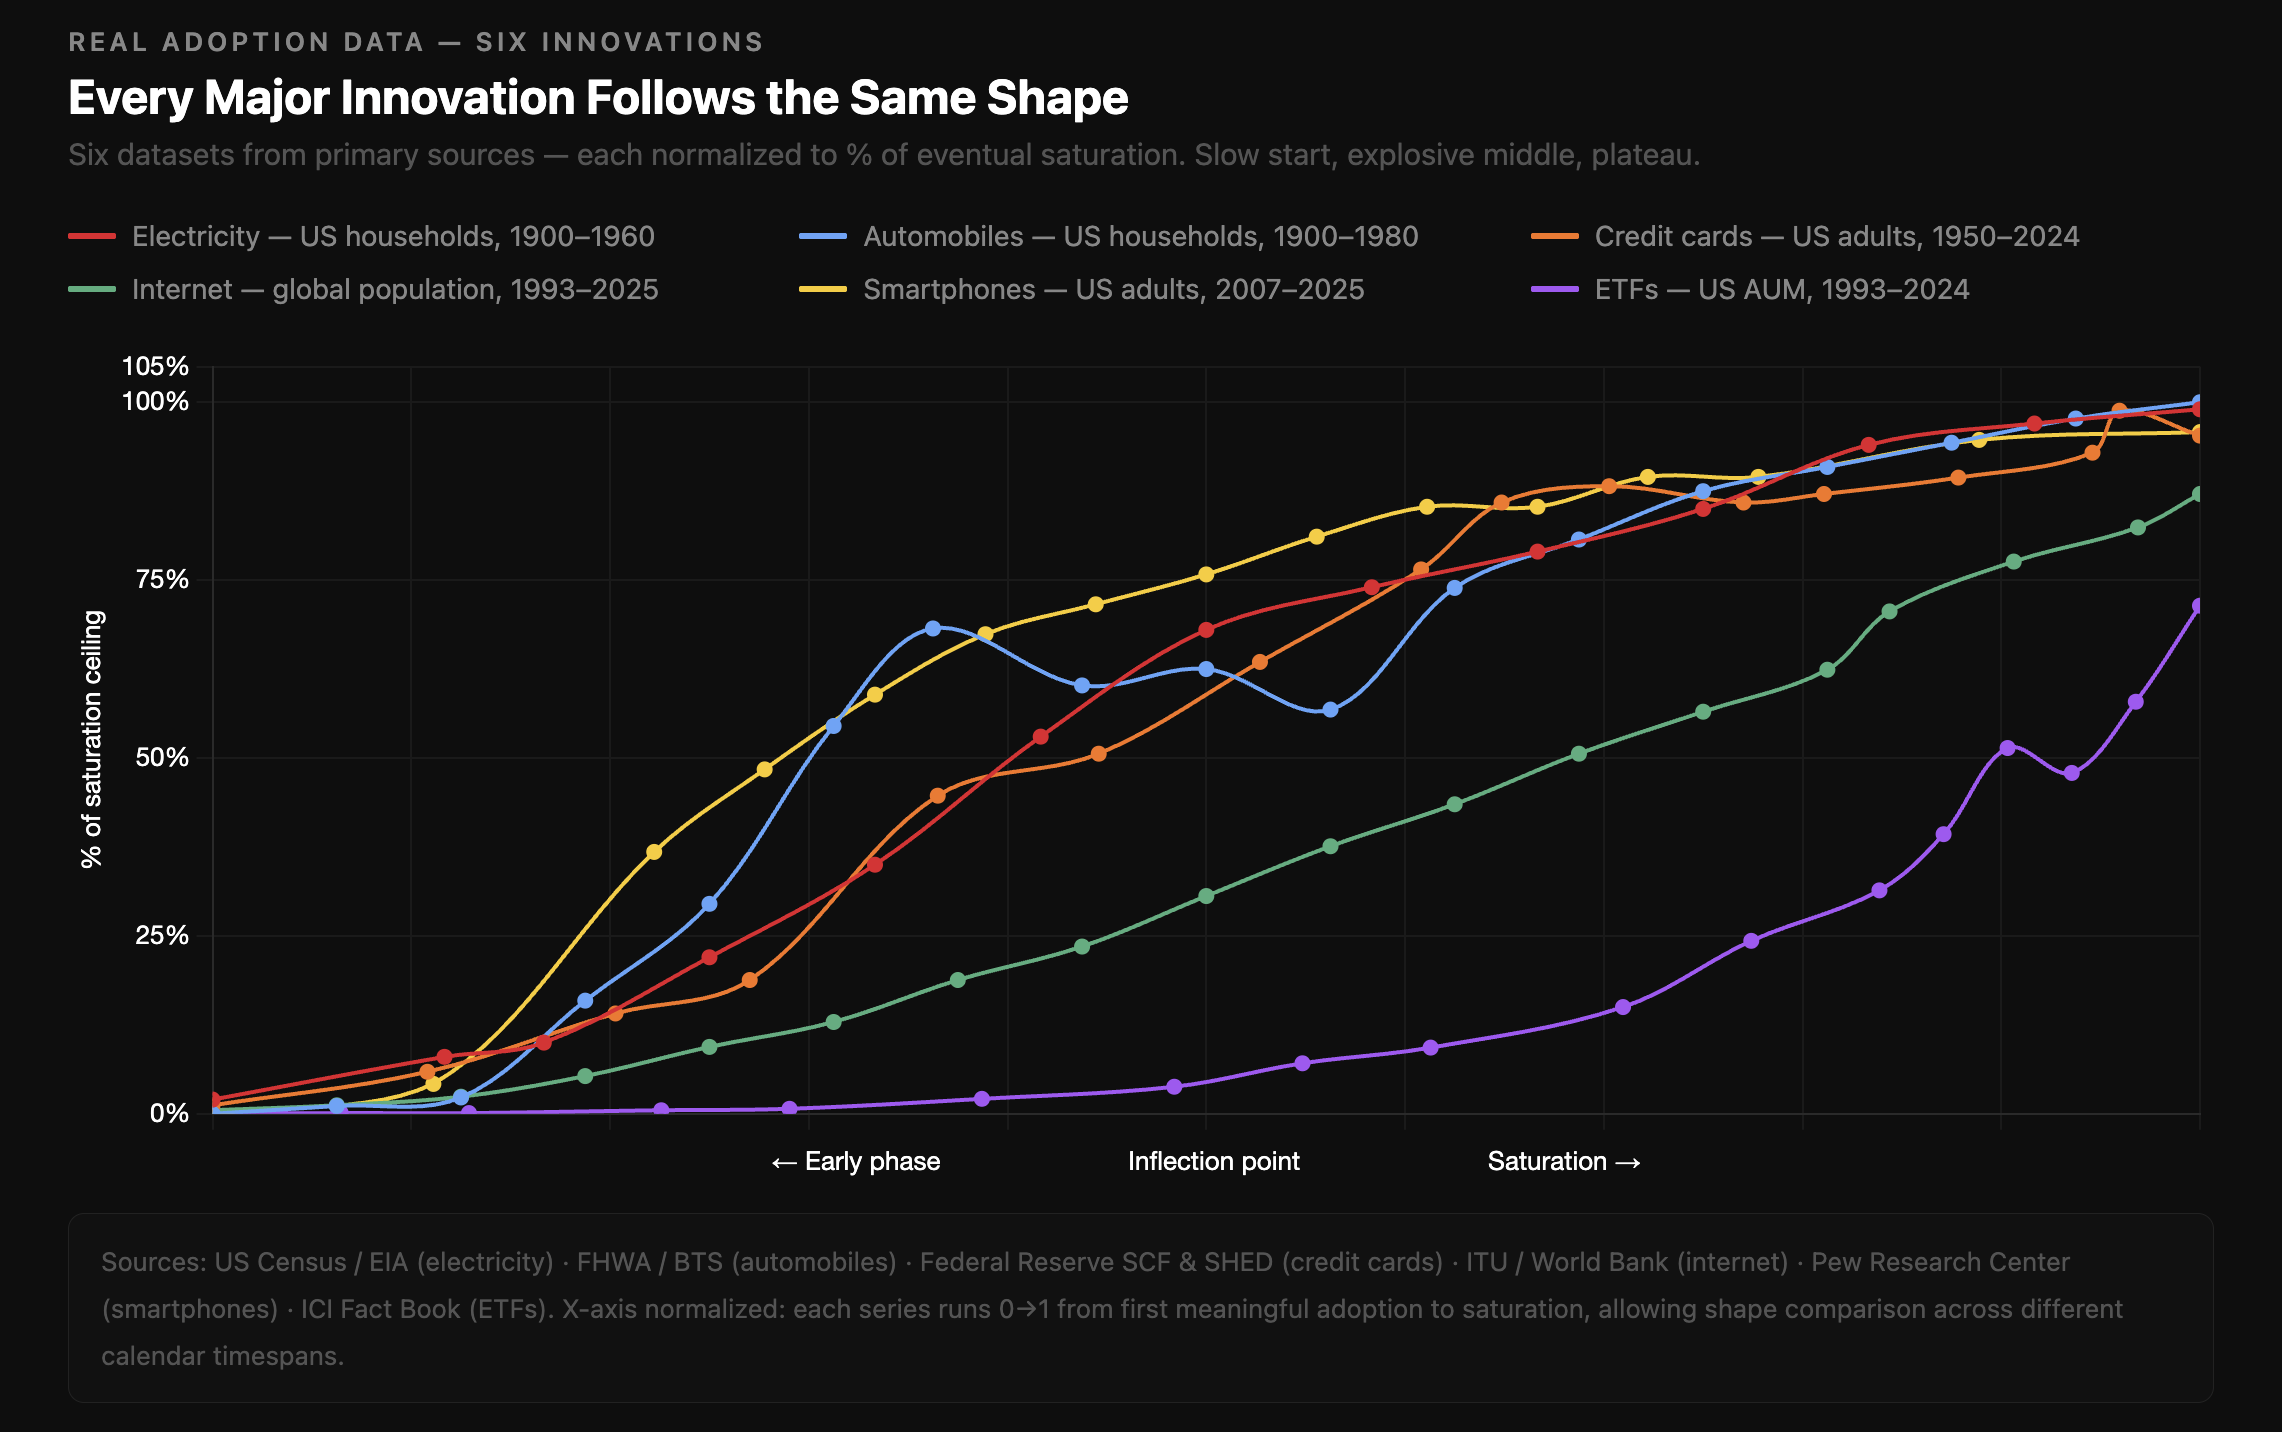
The S-curve marks the transition from push to pull. Early growth is limited by awareness; later growth is fueled by demand and network effects. Be it the internet, smartphones, social media, email, streaming, index funds, ETFs, credit cards, money market funds, electricity, automobiles, antibiotics - the world has seen a number of S-curves amid the adoption for major disruptive innovations.
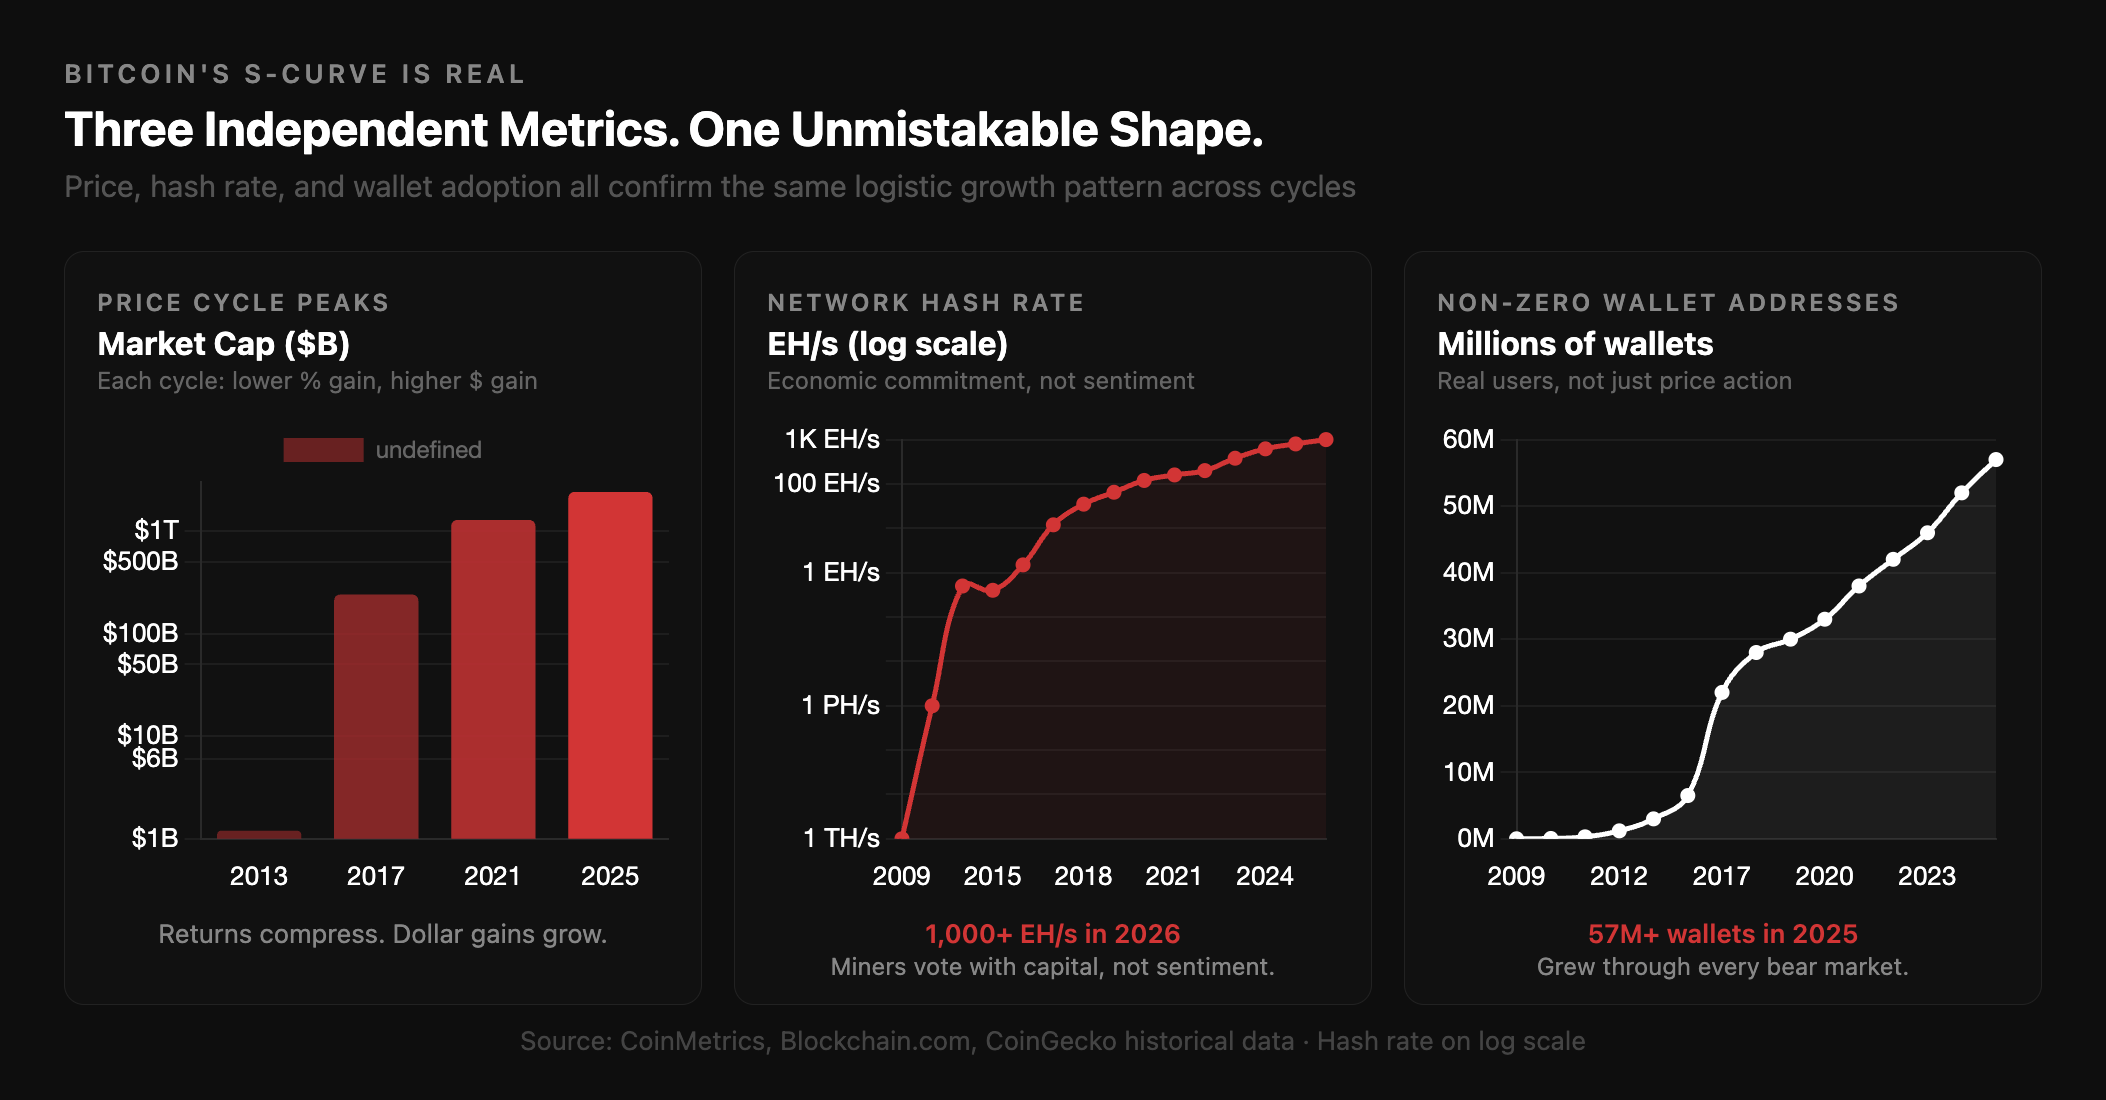
Bitcoin itself is perhaps the most well-documented S-curve in financial history, and the evidence appears across multiple metrics simultaneously. First, bitcoin's price has followed a series of nested S-curves, each one beginning where the last plateau ended. Bitcoin’s 2011 to 2013 bull market cycle saw its market cap grow roughly 100x from trough to peak, followed by a 30x increase during the 2015 to 2017 bull market cycle. More recently, bitcoin exploded 20x from 2019 to 2021 before most recently soaring 8x between 2022 and 2025. Each cycle’s percentage gain compresses while the dollar gain expands, a classic signature of an S-curve moving through successive adoption phases.
Not only that, but the number of unique Bitcoin addresses with non-zero balances is another great example - growing from roughly 1 million in 2012 to over 50 million today. This metric, which tracks real users, has followed an S-curve with its own inflection points, broadly coinciding with bitcoin's bull cycles but continuing to grow even during bear markets as long-term holders accumulate.
Lastly, Bitcoin's total network hash rate, or the computational power dedicated to securing the blockchain, has grown from near zero to over 750 exahashes per second. This is one of the most compelling S-curve signals because hash rate represents economic investment decisions made by miners, not sentiment. Miners only invest in hardware when they believe in bitcoin's long-term value. The sustained exponential growth of hash rate through multiple bear markets confirms that the S-curve is not a price phenomenon, it is a fundamental adoption phenomenon.
Why STRC Should Follow Its Own S-Curve — and Why That Curve Mirrors Bitcoin's
When a new technology or financial instrument emerges, two things are almost always true. First, it follows an S-curve adoption pattern. Second, if it is built on top of an existing platform or asset that is itself on an S-curve, it tends to inherit and amplify that curve's dynamics.
We have seen this repeatedly in financial history. For instance, index funds grew slowly through the 1980s and 1990s, then exploded as institutional adoption tipped and fee compression made them irresistible to retail investors. Exchange-traded funds (ETFs) underwent the same pattern a decade later, riding the wave of platform infrastructure built by the index fund era. In each case, the successor instrument's S-curve was faster and steeper than the underlying technology's earliest cycle because the infrastructure already existed, the investor base was more sophisticated, and distribution was more efficient.
STRC is exactly this kind of second-order innovation. It’s a financial instrument that refines Bitcoin into something it’s never been before: a source of stable, recurring yield, accessible to investors who either couldn’t access the underlying asset, or were uncomfortable with its high volatility. Its adoption curve will be shaped by several forces:
- Institutional Adoption: Bitcoin's continued institutionalization creates a ready and growing base of investors who understand BTC as collateral and are comfortable with bitcoin-adjacent risk. Every new corporate treasury buyer, every new sovereign wealth fund allocation, and every new ETF approval expands the pool of potential STRC buyers.
- Demand for Yield: Traditional fixed income is structurally challenged, real returns have compressed across sovereign and investment-grade debt, and high-yield spreads offer little compensation for the risk taken. The global search for yield has never been more urgent. STRC sits at the intersection of two unsatisfied capital pools. For traditional fixed income investors, it offers 11.5% annually with monthly distributions and no credible comparable in conventional markets. For the $400B+ stablecoin and DeFi ecosystem, it offers something equally scarce: transparent, institutional-grade yield backed by a verifiable balance sheet, in a market where competing products routinely disappoint on risk-adjusted terms. Apyx offers enhanced onchain digital credit yield through our two-token model to serve both.
- Network effects: Liquidity begets liquidity; STRC's average daily trading volume of over $200M by mid-March 2026 creates a self-reinforcing dynamic: more liquidity attracts more institutional participants who require liquidity, which attracts more issuance, which creates more liquidity. Not only that, but STRC can become a more powerful fundraising tool because Strategy can drive more proceeds through its ATM. This too boosts liquidity and helps create a virtuous cycle.
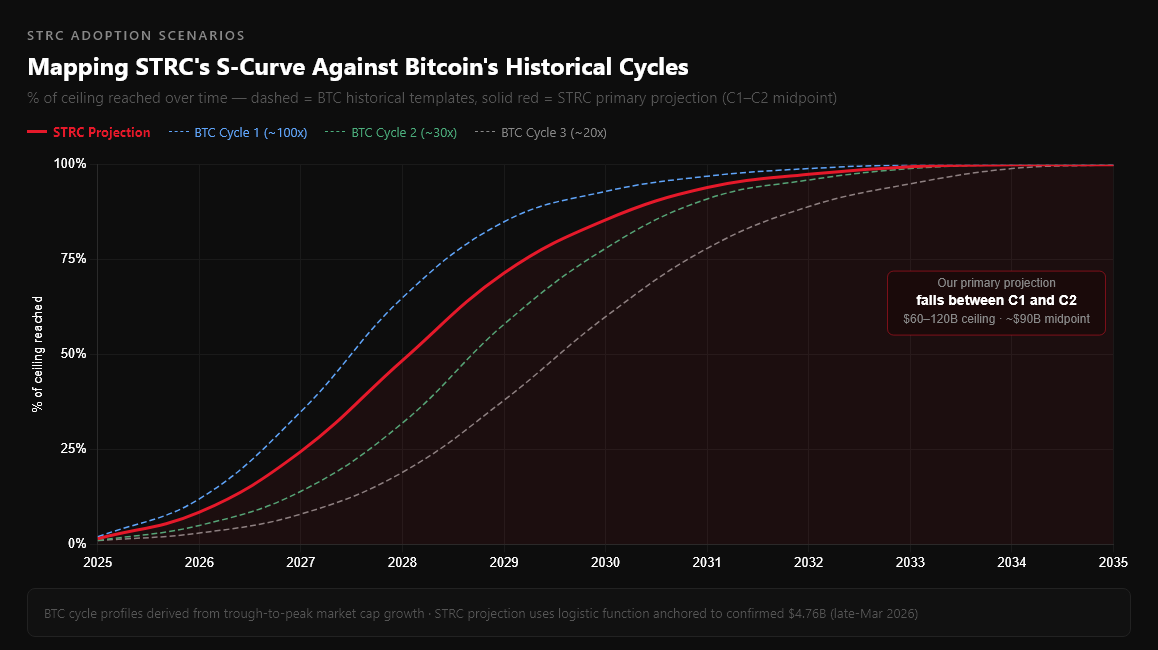
The key question is: which of bitcoin's historical adoption cycles does STRC most closely resemble? Our view is that STRC's S-curve should fall somewhere between bitcoin's Cycle 1 and Cycle 2, and the reasoning is important enough to state clearly.
We believe that STRC cannot perfectly mimic bitcoin's first bull-market cycle (Cycle 1); bitcoin's earliest cycle involved near-zero starting values, zero institutional infrastructure, and a completely uncharted technology finding its first believers. Growth of 100x from an almost-nothing base is categorically different from growth of the same multiple from a multi-billion starting point. Additionally, STRC operates within regulated capital markets with compliance requirements, investor accreditation considerations, and the overhead of institutional adoption processes, none of which bitcoin faced in its earliest days.
But capping STRC’s potential trajectory at Bitcoin’s most recent cycle undersells its potential. The addressable market — global fixed-income capital hunting for yield — dwarfs the Bitcoin investor base at any comparable adoption stage. And STRC achieved in months what took Bitcoin years: institutional credibility, with large institutions like BlackRock already active within its first quarter of trading.
The most intellectually honest projection is therefore a mid-cycle analog: faster and steeper than bitcoin's second bull market cycle from 2015 - 2017, yet more constrained than bitcoin's initial rise to prominence from 2011 - 2013. With that in mind, we will present bitcoin’s first three bull market cycles, then focus on the midpoint of Cycles 1 and 2 as our primary projection.
The Three S-Curve Scenarios: Math, Logic, and Projections
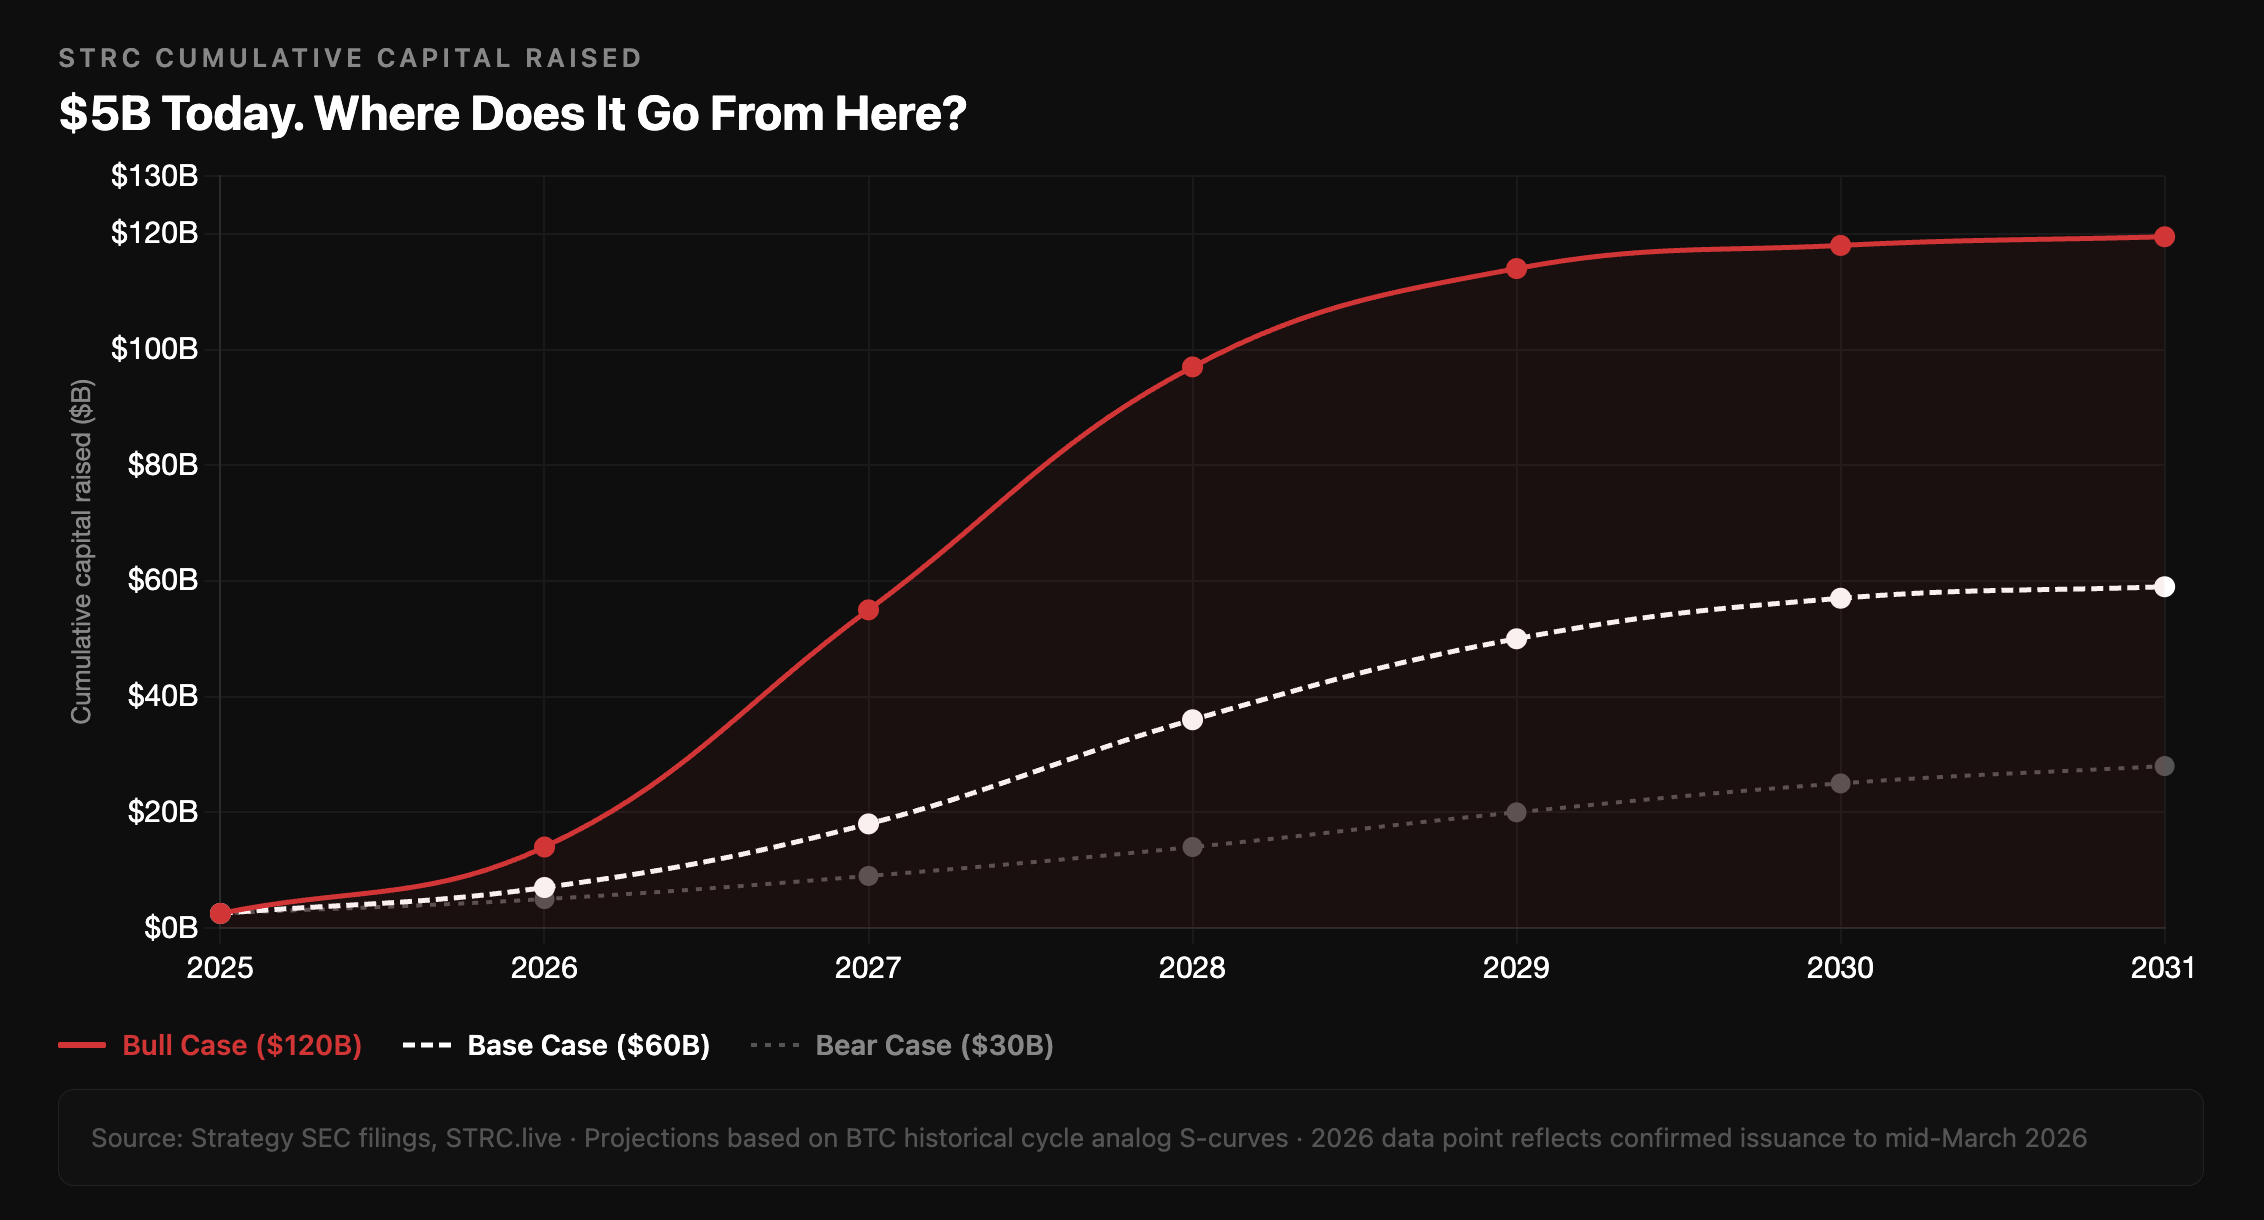
As of early April, STRC has raised approximately $5.35B in cumulative proceeds since its July 2025 IPO, $2.52B from the IPO itself and a further ~$2.24B drawn from its original $4.2B ATM program. The week of March 9 - 16 alone saw $1.18B in STRC issuance, the first time preferred stock surpassed common stock as Strategy's primary bitcoin funding vehicle and a record that itself serves as a data point about the acceleration phase of the S-curve already underway. On March 23, 2026, Strategy filed a new $21B STRC ATM program, a five-fold expansion of the original, alongside a matching $21B MSTR common stock program, signaling that management views the ceiling on STRC demand as far larger than the original $4.2B program implied.
Each scenario models cumulative STRC capital raised through 2030, which is consistent with bitcoin's historical 4-year cycle, using a logistic growth function calibrated to its respective BTC cycle's trough-to-peak growth profile.
Cycle 1 Analog: BTC 2011 - 2013 (~100x)
Bitcoin's market cap grew approximately 100x from trough ($10M) to peak ($10B) in roughly 24 months during its first major cycle. This was the "proof of concept" phase, a completely new asset finding its initial believers without any institutional infrastructure.
Applied to STRC, a Cycle 1 velocity implies STRC’s initial adoption wave having a ceiling of roughly $120B. The logic: if STRC truly represents a new asset class rather than merely a new instrument, and if ‘digital credit’ becomes a recognized category in global fixed income markets the way high-yield bonds or mortgage-backed securities did, then the addressable market is not the existing preferred stock market but the entire $130 trillion global bond market seeking alternatives. Even a 0.1% allocation from that market implies $130B in demand.
Under this scenario, Strategy would need to repeatedly expand its ATM program, which it has already demonstrated it can and will do. The original $4.2B STRC ATM was nearly exhausted by mid-March 2026, and Strategy responded on March 23 by launching a new $21B STRC ATM, a 5x expansion. A Cycle 1 trajectory requires multiple successive program expansions of increasing size, analogous to how Strategy scaled its MSTR ATM programs from hundreds of millions to tens of billions over five years.
Cycle 2 Analog: BTC 2015 - 2017 (~30x)
Bitcoin's market cap grew approximately 30x during its 2015 - 2017 cycle ($200M to ~$240B in roughly 26 months). This was arguably the "institutional and retail discovery" phase, when the entire world recognized bitcoin wasn't going away and began building allocation frameworks. The growth was explosive by any conventional standard but more measured than the founding cycle.
Applied to STRC, a 30x growth from the confirmed $4.74B base implies a ceiling of approximately $60B. This maps logically to a scenario where pension funds, sovereign wealth funds, and fixed-income asset managers begin allocating to STRC as a yield category, not because they are bitcoin enthusiasts, but because the yield, collateral backing, and liquidity profile compares favorably to junk corporate bonds at a fraction of the credit risk.
This scenario requires Strategy to expand its ATM program once significantly, from the current $4.2B to something in the $20 - $30B range, a move that has clear precedent in how STRK's ATM was sized at $21B. The institutional appetite is arguably already being demonstrated: Strategy's total annual preferred dividend obligation crossed $1B in March 2026, implying that investors collectively committed to $1B+ of annual payments in roughly eight months of existence.
The Midpoint: Our Primary Projection
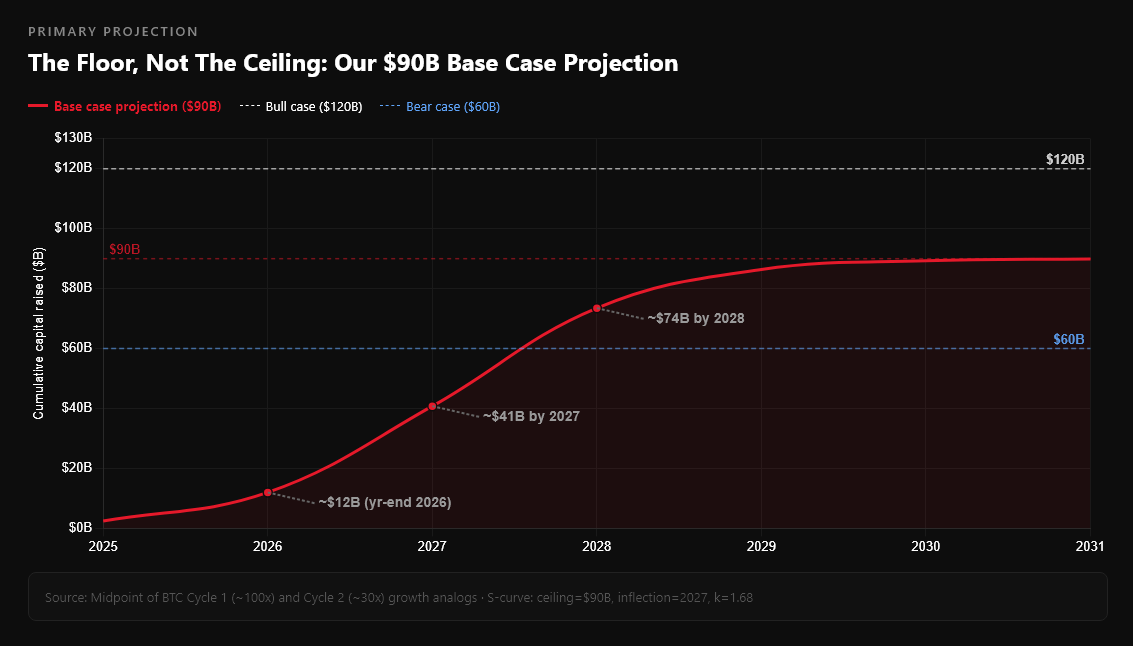
Splitting the difference between Cycle 1 ($120B ceiling) and Cycle 2 ($60B ceiling) yields a midpoint ceiling of approximately $90B, with an inflection point around 2028, steepness calibrated to reflect STRC's demonstrated early acceleration, and a 2026 year-end estimate of approximately $12B.
The reasoning for choosing this as our primary scenario is grounded in three observable facts. First, the acceleration is already happening. The week of March 9 - 16, 2026 saw $1.18B in STRC issuance alone, an annualized rate of over $60B that, if sustained, would exhaust even our Cycle 1 ceiling in roughly two years. We do not expect the record week to be the norm immediately, but it demonstrates that demand at this scale exists right now, eight months into launch.
Second, STRC has a structural advantage that bitcoin did not have in its early cycles: it can be purchased by yield-mandated investors who literally cannot own bitcoin. Pension funds, insurance companies, and certain sovereign wealth vehicles are prohibited from owning volatile assets but can own high-yield preferred securities. STRC opens a completely new capital pool that bitcoin never had access to.
Third, the comparison to bitcoin's Cycle 1 requires intellectual humility. Bitcoin's Cycle 1 multiplier was in part a function of starting from essentially zero. STRC quickly grew to billions, which is simultaneously evidence of remarkable early traction and a higher base that makes pure multiple comparisons less meaningful.
From STRC Dollars to Bitcoin Price: The Transmission Mechanism
This is the part of the analysis that almost nobody is discussing. The implicit assumption in most STRC coverage is that it is a corporate finance story, how Strategy raises capital. What is being missed is that STRC is simultaneously a bitcoin demand story, and the relationship between new demand and bitcoin price is highly non-linear. The transmission from STRC capital raised to bitcoin price impact runs through three stages, each of which amplifies the previous one.
Stage 1: Direct BTC Purchasing
Approximately 95% of STRC net proceeds have been deployed directly into bitcoin purchases, which is documented in every Strategy SEC filing since the product launched. Under the midpoint scenario ($90B ceiling), this implies roughly $85.5B of direct bitcoin buying from STRC proceeds alone, accumulated over approximately a decade.
Stage 2: STRC Fuels MSTR Issuance and the Ripple Effect
The mechanism most analysts overlook is not the direct bitcoin purchase itself, but what STRC's buying pressure sets in motion. When STRC capital flows into bitcoin, it bids up the price. A higher bitcoin price causes Strategy's mNAV to rerate upward, and when mNAV trades above 1, Strategy can issue MSTR common stock at a premium to net asset value, converting that premium into additional bitcoin purchases and increasing BTC per share. In other words, STRC does not merely buy bitcoin once; it repeatedly unlocks the MSTR ATM engine as a secondary source of BTC demand.
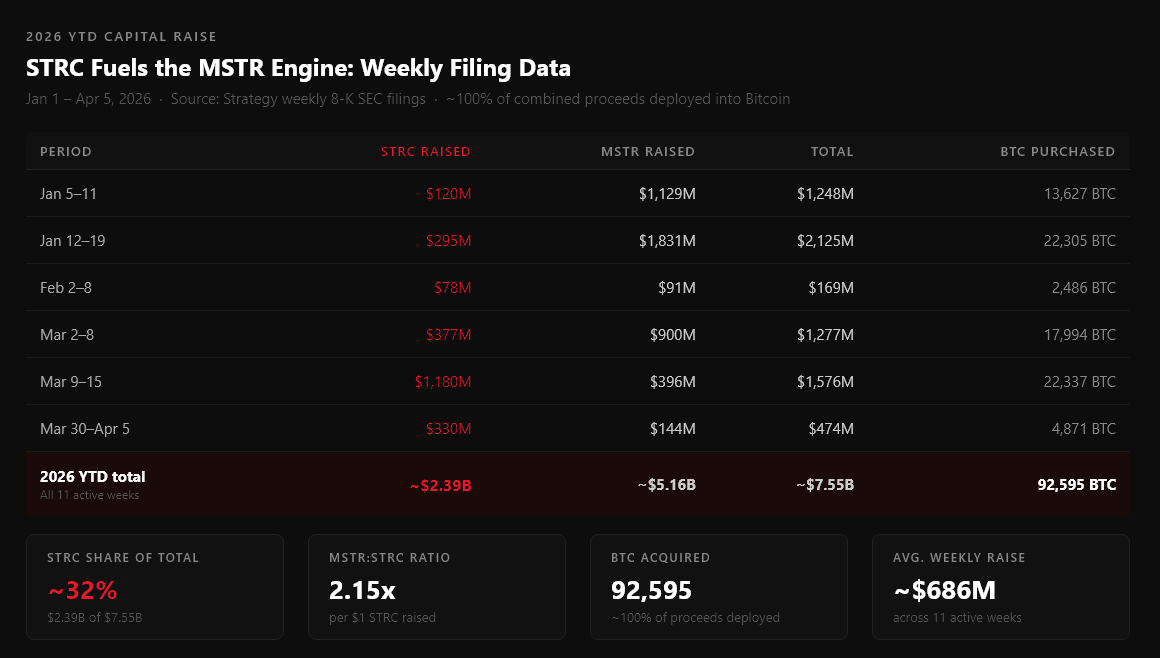
Across 2026 year to date, STRC has accounted for roughly 32% of total capital raised, with MSTR common stock making up the remaining 68%. Put differently, for every $1 raised through STRC, Strategy raised approximately $2.15 through MSTR, with near 100% of both deployed into bitcoin.
For our forward projection, we assume a simplified 1:2 ratio (33% STRC, 67% MSTR), which rounds down slightly from the observed data and is conservative for a second reason: in a bitcoin bull market, when mNAV rerates meaningfully above 1 as it did throughout 2024 and early 2025, Strategy has historically issued MSTR far more aggressively. The 1:2 ratio is therefore a floor, not a ceiling. Applied to our $90B base case, this implies roughly $180B of MSTR co-issuance, bringing combined capital to approximately $270B, virtually all of it deployed directly into bitcoin.
Stage 3: The Market Impact Multiplier
That $270B does not enter a deep, liquid market. According to on-chain UTXO age analysis from CoinMetrics and Glassnode, only approximately 27% of bitcoin's circulating supply is actively liquid at any given time. The remaining supply is distributed across long-term holders who have not moved coins in over a year (roughly 40% of supply, per Glassnode's HODL Waves data as of early 2026), coins locked within spot bitcoin ETF custodians such as BlackRock's iShares and Fidelity's Wise Origin fund (approximately 15% of supply), Strategy's own holdings of roughly 766,970 BTC representing about 3.6% of total supply, and coins considered permanently lost or belonging to dormant early wallets including Satoshi Nakamoto's estimated 1 million coins. Every dollar of new structural demand from a committed accumulator therefore competes for a genuinely thin tradeable float, producing a non-linear price response.
The relationship between dollar inflows and market cap change is well-documented in published research. Onramp Invest's April 2024 analysis using bitcoin's on-chain Realized Value calculated that bitcoin's four-year rolling average demand-to-market-cap multiplier sits at approximately 4x, meaning $1 of net new investment has historically produced $4 of market cap increase. Critically, Onramp's current (spot) reading of this metric as of early 2024 had already climbed to 8 - 10x, driven by the accelerating supply shock from long-term holding and ETF absorption. Separately, the Bank for International Settlements published Working Paper No. 1104 in June 2023 titled "The Crypto Multiplier," establishing the theoretical framework and finding that the multiplier has no upper limit as a greater share of coins shifts from transactional to investment use. The BIS paper notes that bitcoin's payment use share is demonstrably small, implying large multipliers are structurally expected rather than exceptional. A third methodology, derived from a 2022 Federal Reserve payment-proportion study and applied to bitcoin's known supply distribution, produces a central multiplier estimate of approximately 58x.
We apply three multiplier scenarios. The conservative case uses 4x, the Onramp four-year historical average and the most cautious defensible baseline. The aggressive case uses 25x, which is the lower bound of the Fed-derived payment-proportion methodology and less than half its central estimate of 58x. The base case uses 14.5x, the midpoint between our conservative and aggressive assumptions, broadly consistent with the current observed level identified by Onramp and with the lower range of the BIS framework.

What This Triggers: The Second-Order Effects
The numbers above capture STRC and MSTR buying bitcoin. What they cannot fully capture is what happens when Strategy proves this playbook works at $90B scale and the rest of the world draws the same conclusions.
Copycat adoption is already underway; bitcoin treasuries data tracks 360+ public companies with bitcoin on their balance sheets, and Strategy's STRC model is a fully public blueprint, documented in SEC filings and replicated in press releases. The first movers are visible: Strive's SATA perpetual preferred stock, Twenty One Capital, Metaplanet in Japan. If just five additional companies follow at 20% of Strategy's scale, that adds approximately $86B of incremental BTC demand independent of anything Strategy itself does next.
Sovereign accumulation becomes a rational response too. The US Strategic Bitcoin Reserve bill has been filed, El Salvador holds bitcoin as a recognized sovereign reserve asset, Bhutan mines and holds bitcoin at the state level, and Norway's sovereign wealth fund and UAE sovereign vehicles have recently become accumulators. With global foreign exchange reserves totaling approximately $12 trillion, a 1% allocation by sovereign accumulators adds $120B of structural demand entirely outside the corporate treasury channel.
Lastly, it’s important to remember that reflexivity compounds the entire mechanism over time. As bitcoin's price rises on the back of STRC demand, long-term holders hold tighter, reducing the liquid float further. ETF inflows accelerate as more advisors gain access. Strategy continues accumulating, removing more supply. The 14.5x base multiplier we apply today reflects current market conditions; by 2028 - 2030, when the bulk of this capital is actually deployed, that multiplier should be structurally higher. Even the base case is likely understated on a forward basis.
It is also worth being explicit about what our model still does not account for. Institutional allocators moving beyond corporate treasuries into dedicated bitcoin funds, retail adoption that historically accompanies sustained price appreciation above previous all-time highs, and the reflexive MSTR issuance that would accompany a genuine bitcoin bull market at 2x to 3x current mNAV are all omitted. The numbers below represent the documented mechanics applied conservatively. The full picture, including organic demand from a world watching bitcoin systematically absorb fixed-income capital at scale, would be materially larger. Adding it all together across our three multiplier scenarios:
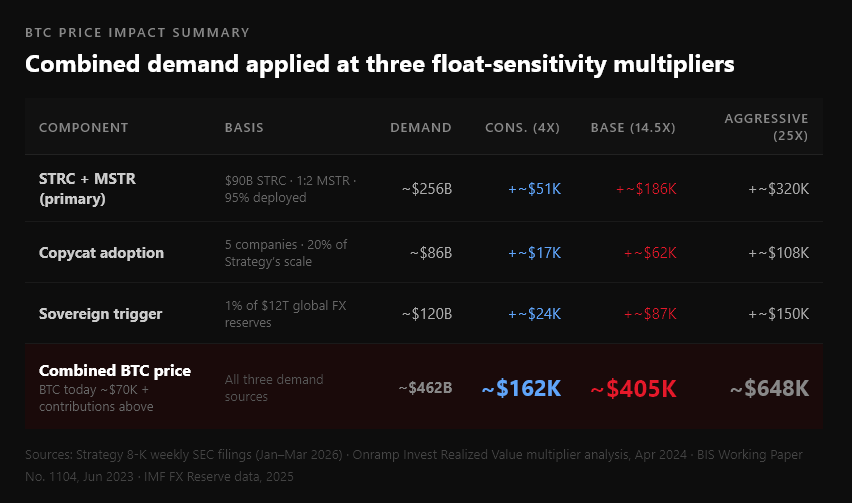
It ought to be noted that these are not total BTC price targets. They represent the additive contribution of the STRC mechanism applied at documented multipliers, on top of whatever bitcoin's price would otherwise be from all other demand sources. The conservative case (~$162K) uses the Onramp four-year historical average. The base case (~$405K) uses the midpoint of our conservative and aggressive assumptions. The aggressive case (~$648K) applies less than half of the Federal Reserve payment-proportion methodology's central estimate of 58x. Each figure is independently falsifiable and a reader who rejects every second-order effect still arrives at ~$121K from the primary mechanism at the conservative multiplier.
Important Caveats
Any projection over a multi-year horizon involves assumptions that may not hold. This analysis is no different, and intellectual honesty demands we name its limitations explicitly.
- The S-curve ceiling is an assumption, not a fact. We have grounded our ceiling estimates in bitcoin's historical cycle multiples applied to STRC's confirmed starting base. But the total addressable market for digital credit is genuinely uncertain.
- Strategy must continue expanding its ATM programs. The current $4.2B STRC ATM was nearly exhausted by mid-March 2026. Reaching even the Cycle 3 ceiling of $30B requires multiple successive program expansions. While Strategy's track record strongly suggests it will do so, each expansion requires board approval, market conditions, and regulatory clearance.
- The MSTR co-issuance ratio may not hold at 2.1x. Our combined $279B demand figure assumes that for every $1 of STRC raised, Strategy raises $2.15 from MSTR, the observed 2026 YTD ratio sourced from weekly SEC filings. This ratio fluctuates meaningfully week to week (ranging from 0.3x to 6x depending on market conditions) and could shift structurally if MSTR's mNAV remains compressed for an extended period. We believe 2.1x is a conservative assumption; bull market conditions historically push MSTR issuance higher, but it is still an assumption about future behavior, not a contractual commitment.
- The float sensitivity multiplier is empirically estimated, not guaranteed. Our 4x/14.5x/25x range is anchored to published research, Onramp's on-chain Realized Value analysis, the BIS 2023 crypto multiplier paper, and a Federal Reserve study-derived methodology. The 4x figure is the most conservative and most historically tested, the 14.5x base is the midpoint between our conservative and aggressive assumptions, and the 25x is a deliberate understatement of the Fed/BIS payment-proportion framework, which produces a central estimate of ~58x. A more liquid, deeper bitcoin market in 2026 - 2030 could compress the multiplier toward the lower end of our range; accelerating float tightening from Strategy, ETFs, and sovereign accumulation could push it above 25x.
- STRC's dividend mechanism depends on Bitcoin staying above critical thresholds. STRC's price stability mechanism requires bitcoin to remain above approximately $25,000 - $30,000 for the balance sheet math to hold. A sustained decline below $40,000 would pressure the financing flywheel, potentially reducing issuance pace and altering the S-curve trajectory. Strategy has $2.25B in cash reserves providing approximately 2.1 years of dividend coverage, but a prolonged crypto winter would stress all of these projections.
- Correlation is not causation across the full cycle. We have mapped STRC's potential trajectory against bitcoin's historical cycles because the structural analogy is compelling. But STRC operates in regulated capital markets, not the peer-to-peer frontier where early bitcoin existed. Regulatory risk, tax law changes, and institutional compliance constraints could cause STRC's adoption curve to diverge from any historical crypto analog.
- This is an isolated demand analysis. Our BTC price impact numbers reflect STRC's contribution in isolation. They do not model the interaction with other demand sources (ETF inflows, corporate treasury adoption, sovereign reserves), nor do they model potential supply-side changes. The actual bitcoin price will be determined by all of these forces simultaneously; STRC is one significant input, not the whole story.
The Conversation Nobody Is Having
In nine months, STRC raised over $5B, navigated two significant bitcoin drawdowns, attracted institutional buyers including BlackRock and Anchorage Digital, and became Strategy's primary vehicle for bitcoin accumulation - all while maintaining price stability that most bonds would envy. Strategy responded to its own success by filing a new $21B ATM the moment the original was exhausted.
The financial press has covered the mechanics and the crypto community has celebrated the purchases, but almost nobody is connecting the math from end to end. STRC does not simply buy bitcoin once. Every dollar of issuance bids up the price, which rerates Strategy's mNAV, which unlocks MSTR common stock issuance at a premium, which buys more bitcoin still. That demand coupled with copycat adoption and sovereign accumulation possesses the power to send bitcoin to prices the world has never seen before.
Needless to say, Digital Credit is in its first S-curve, and the second-order effects have not yet begun. The gap between where we are and where the math points is the opportunity.
Sources
- https://www.strategy.com/press/strategy-announces-closing-of-2-point-521-billion-STRC-stock-initial-public-offering_07-29-2025
- https://www.sec.gov/Archives/edgar/data/0001050446/000119312526107263/mstr-20260223.htm
- https://www.strategy.com/press/strategy-announces-21-billion-strc-atm-program-and-21-billion-mstr-atm-program_03-23-2026
- https://assets.contentstack.io/v3/assets/bltf8d808d9b8cebd37/bltfccad63f1d04ff93/69d333062c747bee51577037/form-8-k_04-06-2026.pdf
- https://www.strategy.com/press/strategy-announces-fourth-quarter-2025-financial-results_02-05-2026
- https://onrampinvest.com/the-bitcoin-multiplier-effect-how-to-explain-bitcoins-4x-rising-price-using-on-chain-data/
- https://www.bis.org/publ/work1104.htm
- https://www.federalreserve.gov/paymentsystems/2023-April-The-Federal-Reserve-Payments-Study.htm
- https://studio.glassnode.com/metrics?a=BTC&m=supply.HodlWaves
- https://insights.glassnode.com/the-week-onchain-week-12-2025/
- https://coinmetrics.io/network-data/
- https://www.coingecko.com/en/coins/bitcoin/historical_data
- https://www.blockchain.com/explorer/charts/hash-rate
- https://studio.glassnode.com/metrics?a=BTC&m=addresses.NonZeroCount
- https://bitcointreasuries.net
- https://blog.bitcointreasuries.net/data-drop-inside-2025s-100-billion-digital-asset-treasury-boom/
- https://www.ishares.com/us/products/333011/ishares-bitcoin-trust-etf
- https://www.fidelity.com/crypto/fidelity-crypto-fund
- https://data.imf.org/COFER
- https://defillama.com/stablecoins
- https://www.sec.gov/cgi-bin/browse-edgar?action=getcompany&CIK=MSTR&type=8-K