
Making Smart Contracts Observable, Finally
Apyx built and open-sourced the evm-contract-exporter, a tool that makes smart contract state observable through the same monitoring infrastructure teams already use. Track onchain values over time, build dashboards, and create alerts around the contract metrics that matter most.

During a depeg, oracle outage, or liquidity crunch, the most important numbers and data are not typically sitting in a clean dashboard for any and all to see. They’re instead buried deep inside smart contracts.This is a problem for teams building onchain products where servers, APIs, and databases are monitored. But the contracts that actually do all the work under the hood are often watched manually via block explorers, custom scripts, or one-off alerts. We believe this is a standard that should not exist.
At Apyx, we built the evm-contract-exporter to make smart contract state observable by way of the same monitoring stack teams already use today, including Prometheus, Grafana, and Alertmanager. So instead of refreshing Etherscan during an incident, teams can now track contract values over time, build dashboards, and create alerts around the onchain metrics that are most important.
In this post, we’ll explain why smart contract state belongs in your monitoring stack, how evm-contract-exporter turns onchain values into Prometheus metrics, and how Apyx uses it to track contract health across production deployments. Readers can expect to walk away understanding why relying on block explorers and one-off scripts is not enough, how contract data can be monitored like any other infrastructure metric, and how teams can start building dashboards and alerts around the onchain values that matter most.
What Is It Exactly?
evm-contract-exporter is a Prometheus exporter for smart contract state. One Rust binary, one YAML config per chain. The config lists the contract addresses and the view or pure functions you care about. On a timer, the exporter batches the calls through Multicall3 (chunked, 500 calls per request by default), then decodes the numeric and boolean returns into gauges on /metrics.

It is deliberately not an indexer. There is no database and no event pipeline. If you need historical trades or transfer logs, use something else, but if you want to record, visualize and alert on contract state over time, use the evm-contract-exporter.
It started life as an internal Go tool at Apyx. We ported it to Rust and stripped out the Apyx-specific parts for public release under the Apache-2.0 license. The container image lives at ghcr.io/apyx-labs/evm-contract-exporter, and the repo ships a Helm chart for running it in Kubernetes.
A Real Example
To help further set the stage, here is a config that watches two mainnet contracts we care about during exactly the kind of incident described above: the Curve stETH/ETH pool and the Chainlink ETH/USD feed. The pool gives you peg composition and health (how much ETH versus stETH is actually sitting in it, and the growth of its invariant per LP token). The feed gives you the oracle price and, just as important, the timestamp of its last update, which is what you alert on when an oracle goes stale.
chain:
  rpc_url: ${ETH_RPC_URL}
  chain_id: 1
  block_tag: finalized
labels:
  chain: ethereum
contracts:
  - name: curve_steth_pool
    metric_prefix: curve_steth_pool
    abi_inline: |-
      [
        {"type":"function","name":"get_virtual_price","inputs":[],"outputs":[{"name":"","type":"uint256"}],"stateMutability":"view"},
        {"type":"function","name":"balances","inputs":[{"name":"i","type":"uint256"}],"outputs":[{"name":"","type":"uint256"}],"stateMutability":"view"}
      ]
    instances:
      - address: "0xDC24316b9AE028F1497c275EB9192a3Ea0f67022"
        labels:
          pool: steth_eth
    metrics:
      - function: get_virtual_price
        help: "Growth of the stETH/ETH pool's invariant per LP token."
        outputs:
          - index: 0
            scale: 1e18
      - function: balances
        help: "Pool balance per coin, in whole tokens."
        calls:
          - args: ["0"]
            labels: { coin: eth }
          - args: ["1"]
            labels: { coin: steth }
        outputs:
          - index: 0
            scale: 1e18
  - name: chainlink_eth_usd
    metric_prefix: chainlink_eth_usd
    abi_inline: |-
      [
        {"type":"function","name":"latestRoundData","inputs":[],"outputs":[{"name":"roundId","type":"uint80"},{"name":"answer","type":"int256"},{"name":"startedAt","type":"uint256"},{"name":"updatedAt","type":"uint256"},{"name":"answeredInRound","type":"uint80"}],"stateMutability":"view"}
      ]
    instances:
      - address: "0x5f4eC3Df9cbd43714FE2740f5E3616155c5b8419"
        labels:
          pair: eth_usd
    metrics:
      - function: latestRoundData
        help: "Latest ETH/USD answer and its update timestamp."
        outputs:
          - index: 1
            name: answer
            scale: 1e8
          - index: 3
            name: updated_at
One detail worth pausing on: balances takes a coin index, and we want both coins. The calls list handles that. Same function, different args, a label per call, so balances(0) becomes the coin: eth series and balances(1) becomes coin: steth, without duplicating the whole stanza.
Here is what the exporter actually served on /metrics when we scraped mainnet, pinned to finalized block 25496958:
curve_steth_pool_get_virtual_price{address="0xdc24316b9ae028f1497c275eb9192a3ea0f67022",chain="ethereum",chain_id="1",pool="steth_eth"} 1.1401408078862825
curve_steth_pool_balances{address="0xdc24316b9ae028f1497c275eb9192a3ea0f67022",chain="ethereum",chain_id="1",coin="eth",pool="steth_eth"} 19120.3633824318
curve_steth_pool_balances{address="0xdc24316b9ae028f1497c275eb9192a3ea0f67022",chain="ethereum",chain_id="1",coin="steth",pool="steth_eth"} 21810.048291065268
chainlink_eth_usd_latest_round_data_answer{address="0x5f4ec3df9cbd43714fe2740f5e3616155c5b8419",chain="ethereum",chain_id="1",pair="eth_usd"} 1751.9829
chainlink_eth_usd_latest_round_data_updated_at{address="0x5f4ec3df9cbd43714fe2740f5e3616155c5b8419",chain="ethereum",chain_id="1",pair="eth_usd"} 1783622507
Notice the values are readable numbers, not 21-digit integers. Onchain values are fixed-point: the pool reports balances in wei and Chainlink reports the price with 8 decimals. The scale field in the config divides the raw value on the way out, so scale: 1e18 turns wei into whole tokens and scale: 1e8 turns the feed's answer into dollars.
The naming follows from the config. A single-output function maps straight to <prefix>_<function>, which is how you get curve_steth_pool_get_virtual_price. A multi-output function gets the output name appended, which is how latestRoundData becomes chainlink_eth_usd_latest_round_data_answer and _updated_at. The address and chain_id labels come for free on every series.
To try it against a public endpoint (grab the container image mentioned above, or cargo build --release from the repo):
ETH_RPC_URL=https://ethereum-rpc.publicnode.com \
  evm-contract-exporter --config example.yaml --validate-only
--validate-only does more than check the schema. It makes live probes against the endpoint: does the chain id reported by the RPC match the config, and does the block tag resolve to a real block? A typo'd chain id or a dead endpoint fails at deploy-time instead of during your next incident.
How It All Works
The pipeline is short enough to draw. At startup a planner turns the YAML into a deduplicated call plan and registers the gauges. From there a scrape loop runs the plan every 30 seconds by default and turns whatever the chain returns into gauge updates.
flowchart LR
    cfg[YAML config] --> planner["Planner<br/>dedupe calls, register gauges"]
    planner --> loop["Scrape loop<br/>every 30s"]
    loop --> mc["Multicall3 aggregate3<br/>chunks of 500"]
    mc --> dec["Decoder<br/>uint256 to scaled f64"]
    dec --> gauges["Gauges on /metrics"]
    prom[Prometheus] -->|scrapes| gauges
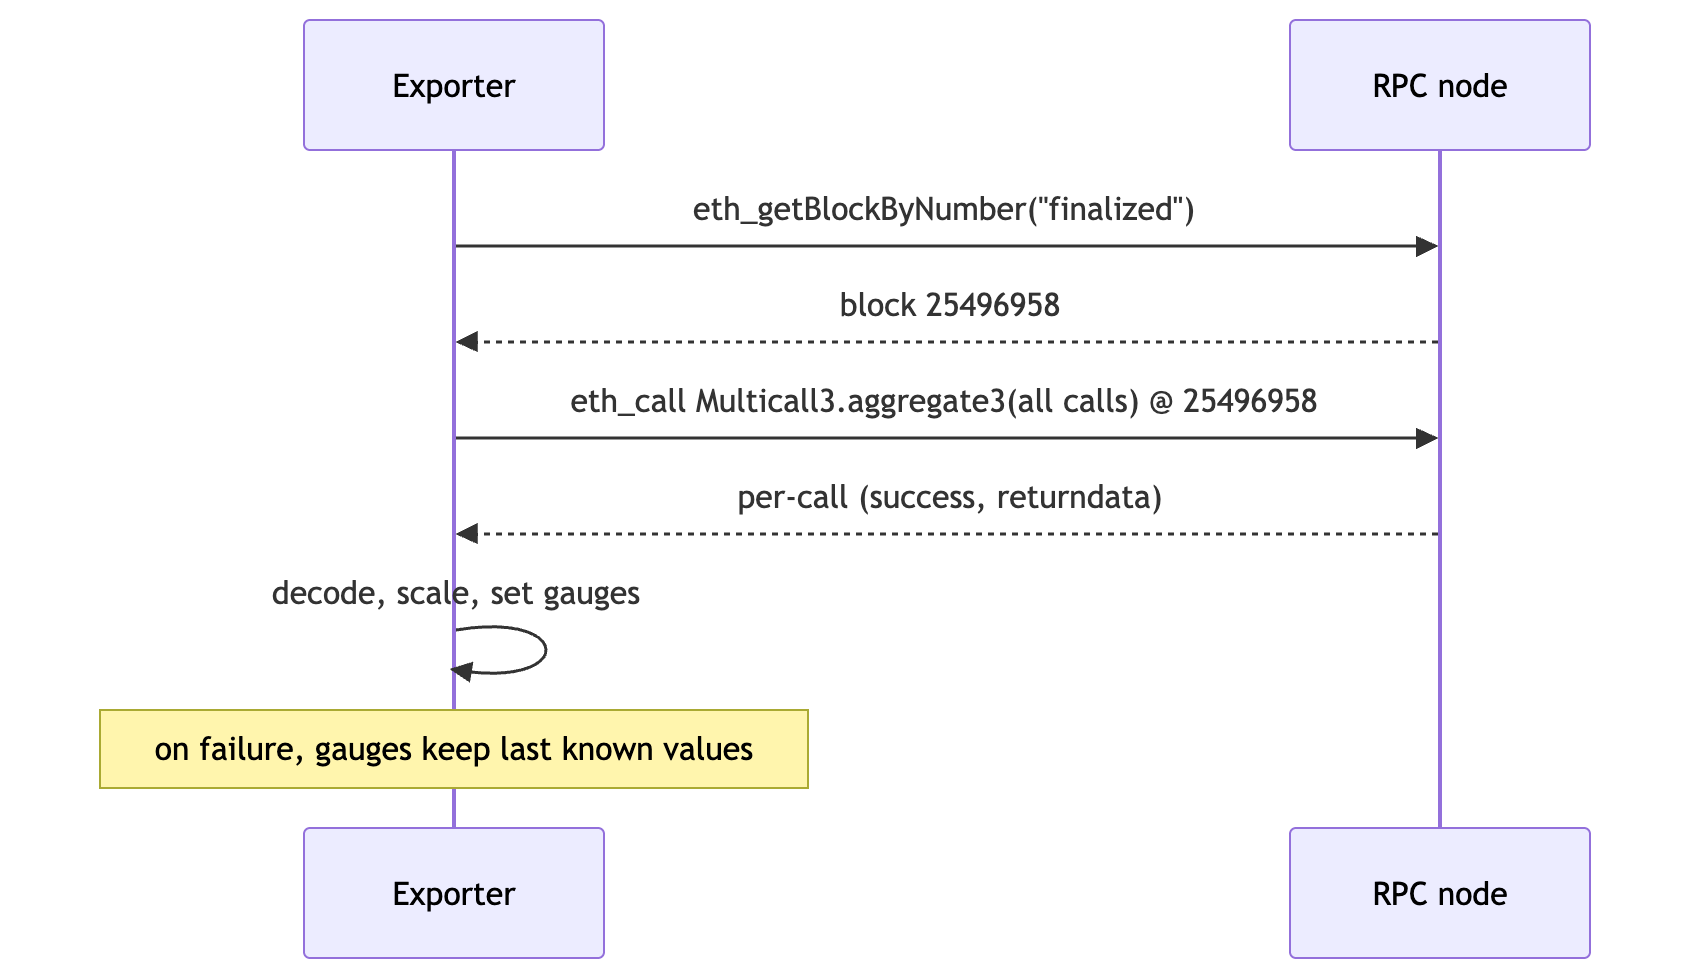
A single scrape is two RPC round trips: one to resolve the block tag to a concrete number and one Multicall3 aggregate3 call carrying everything else, pinned to that block. Each subcall runs with allowFailure: true, so one reverting contract cannot take down the rest. The scrape quoted above resolved the finalized block 25496958 and finished its 4 calls in a single chunk in 84ms.
sequenceDiagram
    participant E as Exporter
    participant N as RPC node
    E->>N: eth_getBlockByNumber("finalized")
    N-->>E: block 25496958
    E->>N: eth_call Multicall3.aggregate3(all calls) @ 25496958
    N-->>E: per-call (success, returndata)
    E->>E: decode, scale, set gauges
    Note over E: on failure, gauges keep last known values
Block pinning is an opinion, not an accident. Every value in a scrape comes from one block, resolved once. The default tag is finalized (latest and safe are also supported), so dashboards trade a couple of minutes of freshness for never showing reorged state. The half we really care about is the same-block guarantee. A peg ratio built from two series only means something if both numbers came from the same block. Two values from two different blocks can lie to you, and the lie looks exactly like the divergence you are watching for.
Two smaller details belong here too. If several metrics read the same (address, calldata) pair, the planner collapses them into a single subcall. Deployment is one instance per chain with a single replica; a second replica just doubles your RPC bill.
Failure handling is another opinion. When a scrape fails, gauges keep their last known values rather than zeroing or disappearing, because zeroed gauges during an RPC outage are indistinguishable from a catastrophe on chain and someone will get paged for a depeg that never happened. Held values plus an explicit error signal tell the truth: as far as we can tell nothing moved, we have simply lost our view of it. The signal lives in the exporter's self-metrics. evm_exporter_scrape_errors_total counts failures by reason, while evm_exporter_last_scrape_success_timestamp_seconds tells you how stale the data has become; alert on those, not on gaps in your graphs. Even /healthz stays 200 when the RPC is broken, because the process itself is fine.
How We Use It
Everything above is the generic tool; here is what it actually watches for us. We run three exporter instances in production, one per chain on the three chains we deploy to, covering a few dozen contracts. That comes to a few hundred metric series refreshed every 30 seconds, and it has quietly become the substrate for most of our onchain monitoring.
What's Next?
The evm-contract-exporter is the very first piece of internal Apyx tooling that we’ve decided to open-source. We believe this tool solves a major problem onchain developers have struggled with for far too long: reliable, readable, and integrated contract monitoring.
The repo is live today at github.com/apyx-labs/evm-contract-exporter. Pull your latest contract, connect it to Prometheus, and see which onchain values belong on your dashboard(s).
If a decoder chokes on your contract or the config cannot express something you need, don’t hesitate to open an issue or send a PR. We would love to see what other teams monitor with it.
Stay tuned for more open-source work at Apyx.